Making Scientific Running Analysis, Human

Nike Innovation Lab

The Mission

Transform a lab experience perceived to be ‘cold’ and ‘for elite men only’ into a comprehensive suite that brings out the why (the people) in the what (the data).

The Result

A 0 to 1 product redesign (responsive web product), applications, scientific report, design system, design guidelines, token library, component library, UI/UX, and motion design.
User Research & Strategy:
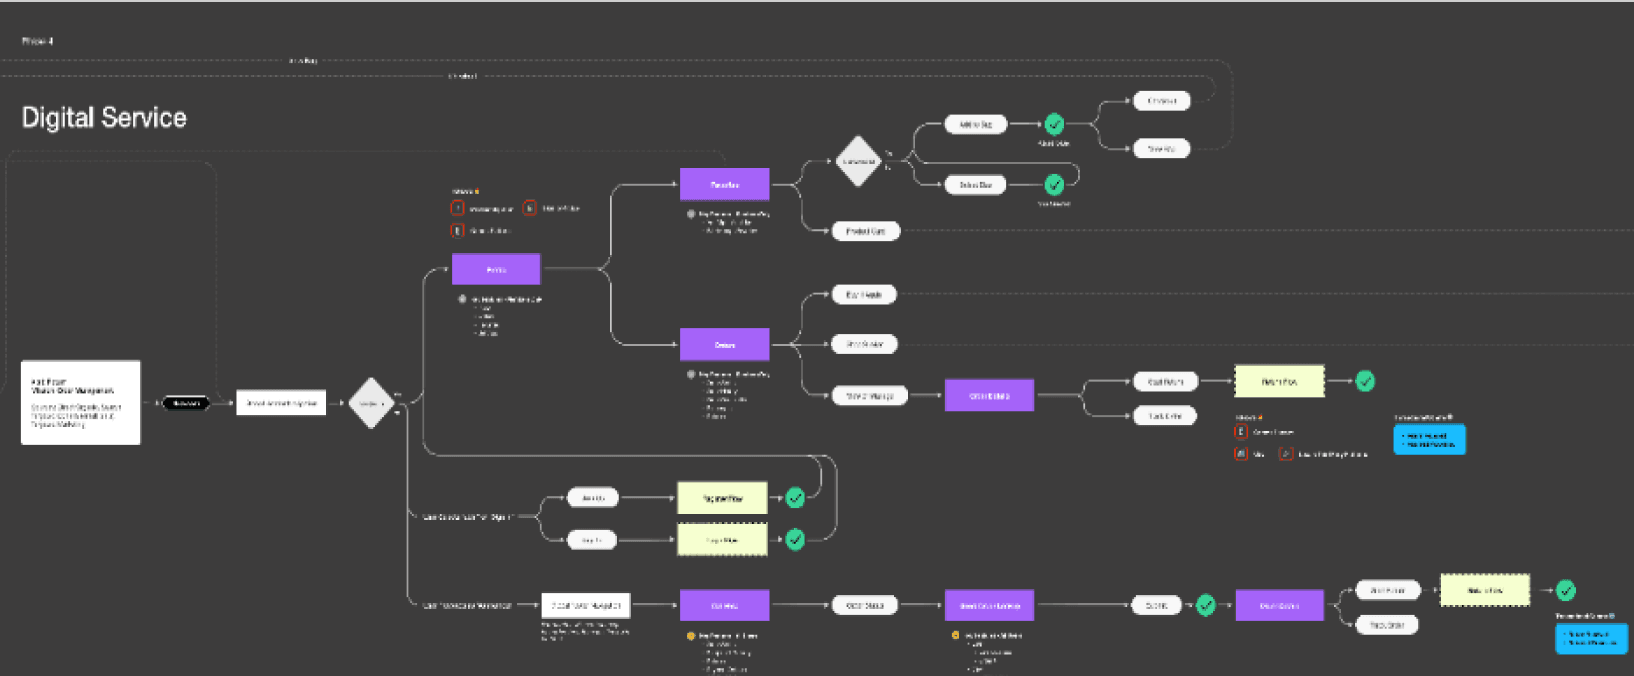
Starting with user research helped level-set the core team of Exec, Science, Marketing and Service Leads into a shared understanding that running analysis should appeal to new runners first. Breaking down digital touchpoints and then entering them as user stories on a design kanban, I worked with the team to create a transparent design strategy. Work was then prioritized, collaboratively, with the core team and Engineering Architect.

Breaking down digital touchpoints and then entering them as user stories on a design kanban, I worked with the team to create a transparent design strategy. Work was then prioritized, collaboratively, with the core team and Engineering Architect.
User research:
Starting with user research helped level-set the core team of Exec, Science, Marketing and Service Leads into a shared understanding that running analysis should appeal to new runners first.
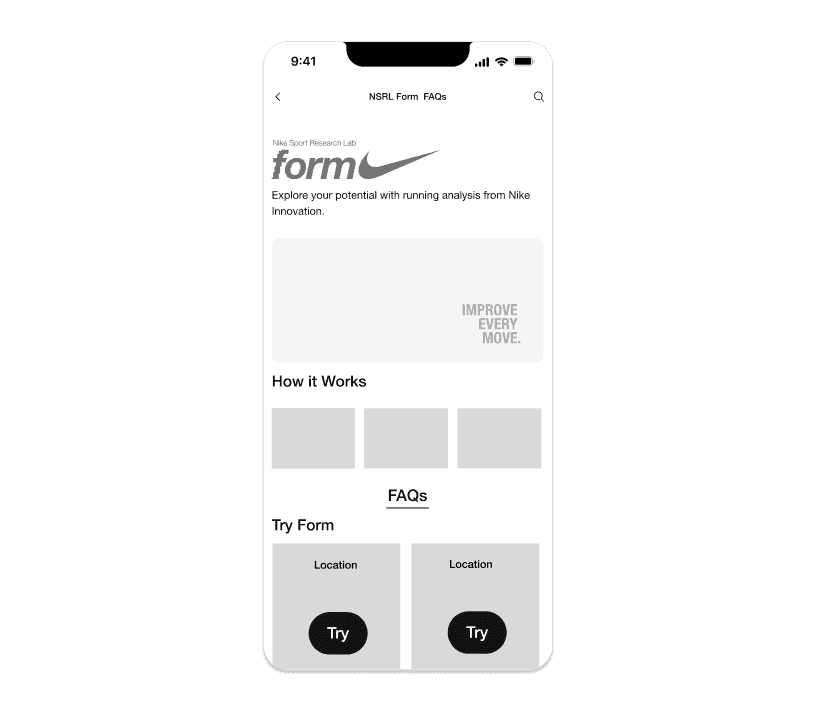
I then created interactive wireframes flows of key processes so we could test in usertesting.com and demonstrate to stakeholders.
Wireframes and Testing:
I then created interactive wireframes flows of key processes so we could test in usertesting.com and demonstrate to stakeholders.
Responsive websites and applications were created using a new visual design system. Creating repeating patterns in the designs greatly sped up development.
Responsive UX and UI:
Responsive websites and applications were created using a new visual design system. Creating repeating patterns in the designs greatly sped up development.
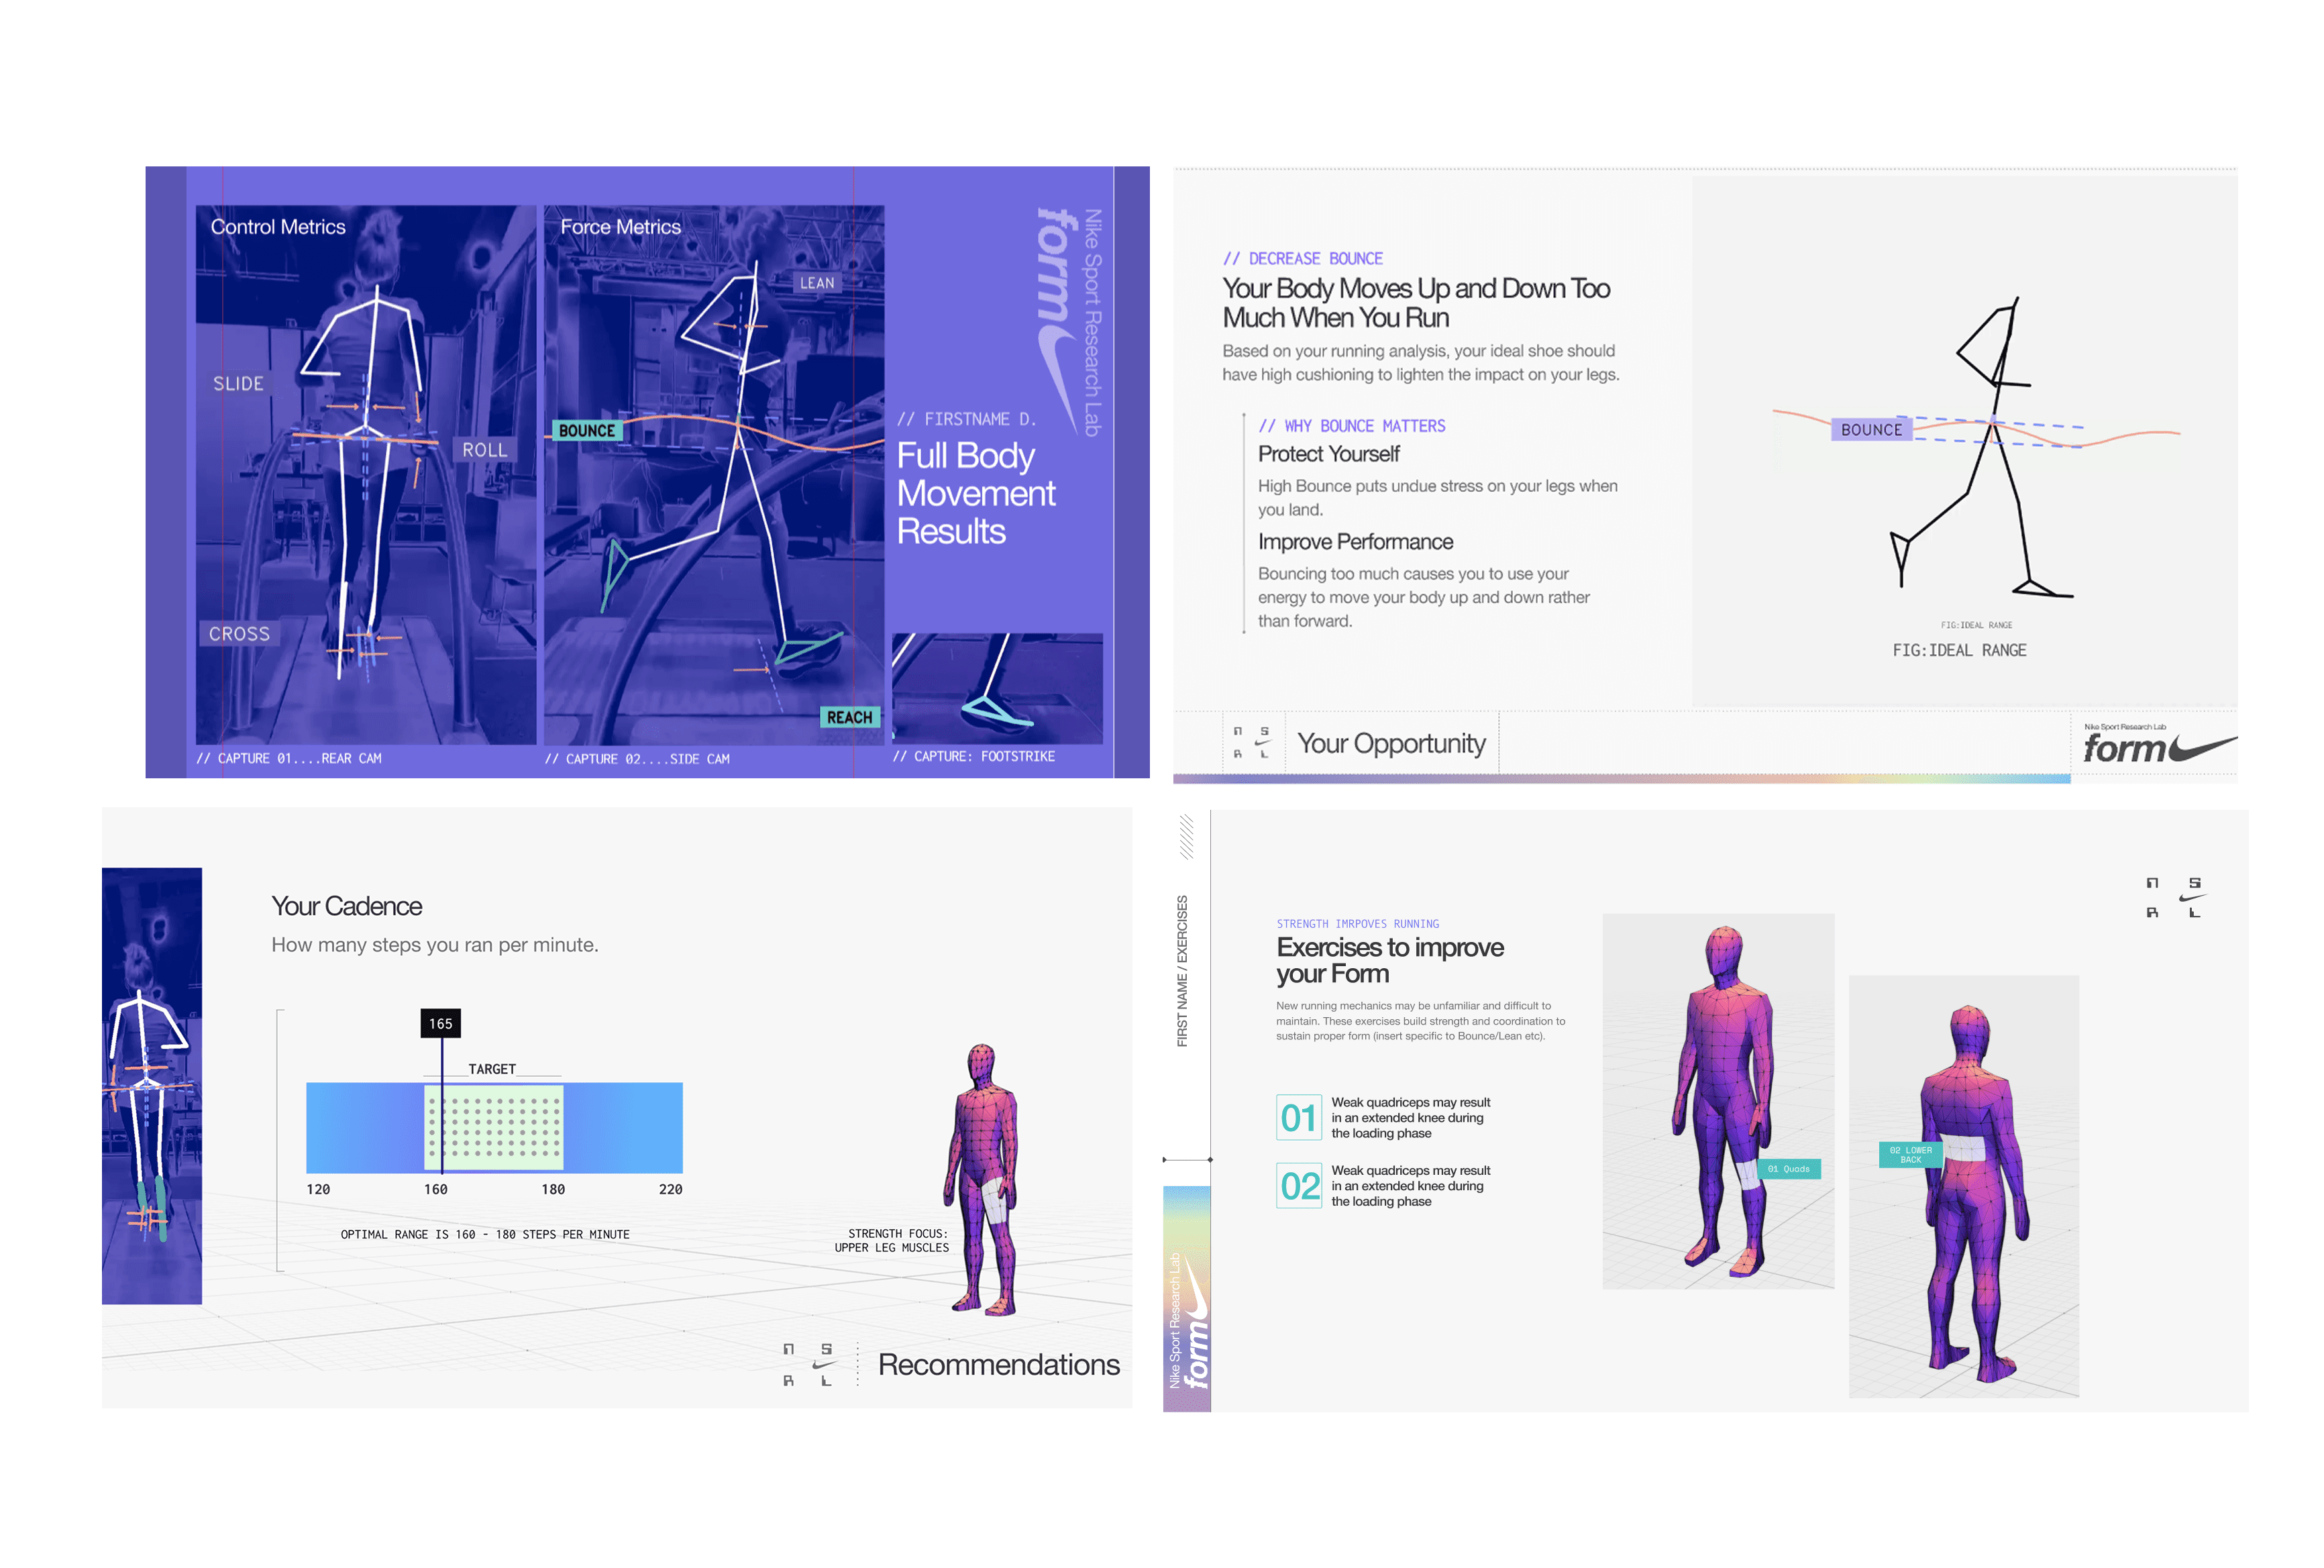
^ Working with the Lead Service Designer, we remade the pacing of the digital report runners receive after they run. Feedback (from a feedback design itself) showed that the new report increased adoption of recommendations by 70%.
Service Design and Scientific Dissplay:
Working with the Lead Service Designer, we remade the pacing of the digital report runners receive after they run. Feedback (from a feedback design itself) showed that the new report increased adoption of recommendations by 70%.
Motion Design:
Adding motion to the website by creating short instructional videos and animating headers helped bring life to the digital experience, without requiring additional development time.
Motion Design:
Adding motion to the website by creating short instructional videos and animating headers helped bring life to the digital experience, without requiring additional development time.
Physical Space Design & Flow:
After re-working the display of scientific data, we added it to the physical spaces where runner ran, in order to increase awarentss about what to expect.